Recyclables
Recover
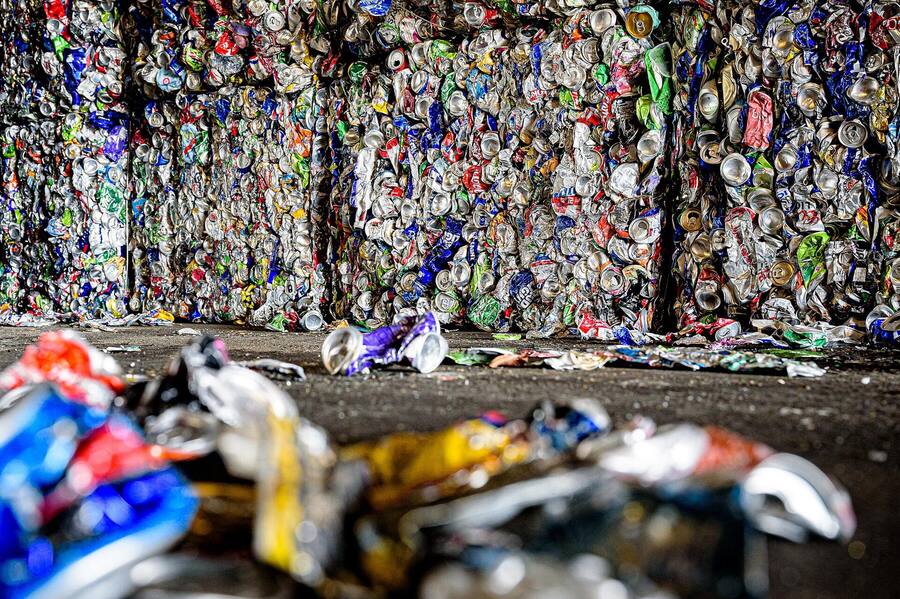
Size sorting lines and set realistic capture targets for paper, plastics, glass and metals.
Chapter 01 · The city
Waste composition analysis
Source: World Bank, What a Waste 2.0 (2018)
Chapter 02 · The bag
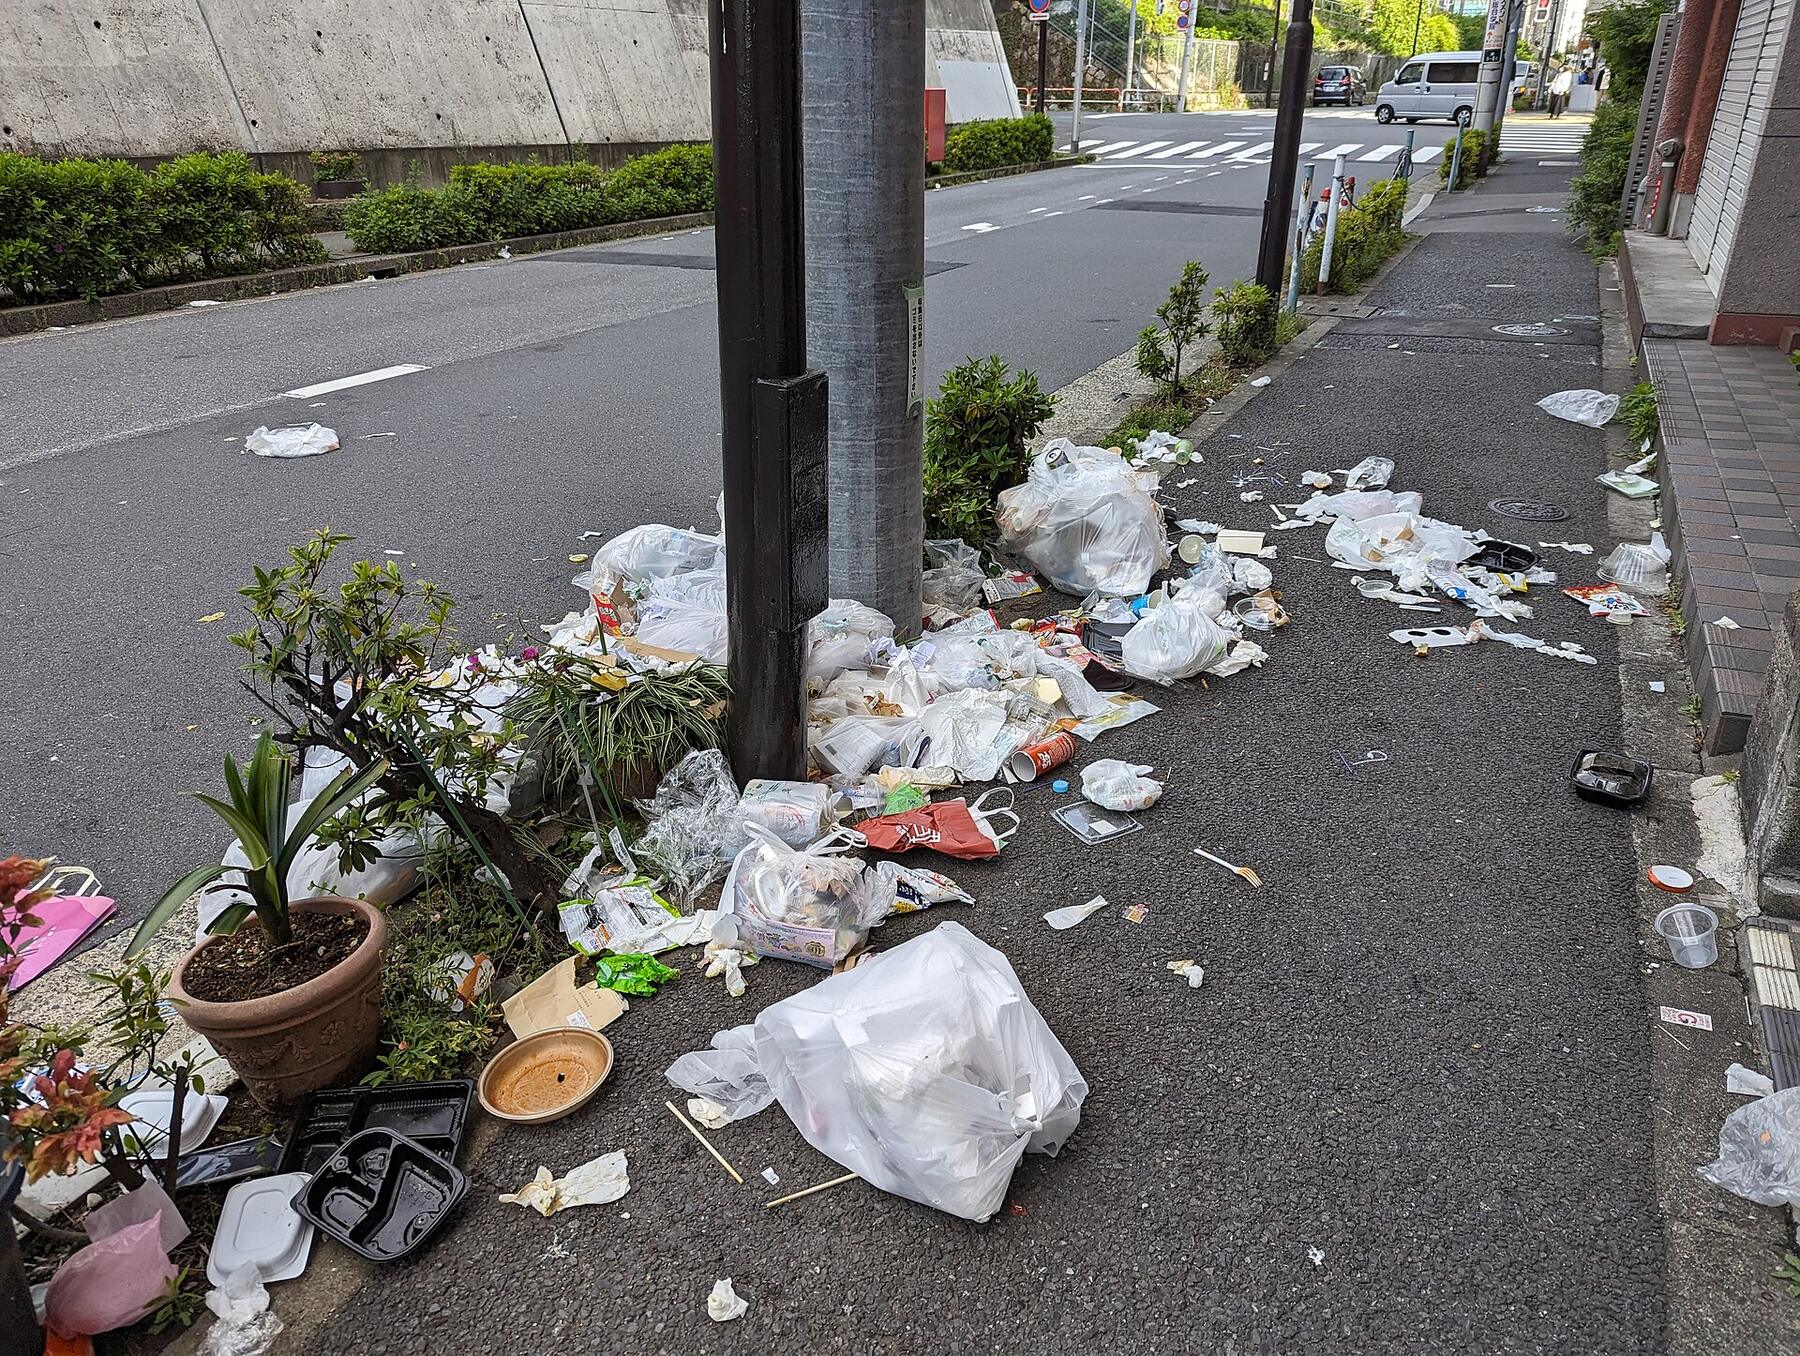
Planners set targets, size plants and price packaging fees on estimates. When the estimate is wrong, a plant is built too big, a target is missed, or a producer pays the wrong fee.
Source: World Bank, What a Waste 2.0 (2018)
Chapter 03 · The rules
Recycling, landfill and packaging targets are reported against real tonnages. Estimates that were good enough for a master plan are not good enough for a regulator.
Source separation becomes a duty for public bodies and large sites, with a national goal of 60% recovery by 2035.
Producers pay a recovery contribution (GEKAP) on packaging they place on the market.
Regulation (EU) 2025/40 on packaging and packaging waste applies from 12 August 2026.
Municipal waste must reach 65% recycling, with no more than 10% sent to landfill.
Every one of these targets is measured against a baseline. Most cities have never sorted their own waste.
Chapter 04 · The sample
Samples are drawn at random from real trucks, on a logged schedule. The plan is stratified so every part of the city counts in proportion to what it produces.
Chapter 05 · The sort
Illustrative sample. Real studies use 30–60 categories.
The sample is tipped onto a screened sorting table. Fines under 10 mm fall through and are weighed on their own.
Trained crews pick each item into an agreed category tree: food, garden, paper, film, rigid plastic, PET, glass, metals and more.
Each category goes onto a calibrated scale. The weight is captured on a tablet with a photo, so nothing is retyped later.
Sorted weights must add back up to the sample weight. Any gap above tolerance is investigated before the sample is accepted.
Chapter 06 · The numbers
We weight every sample by the stratum it represents and report each category with its confidence interval. You see what the data can support, and where it cannot.
Illustrative results.
Chapter 07 · The data
Every weight is entered once, on a tablet at the sorting table. It reaches your dashboard the same minute, with its photo and its sample record.
Chapter 08 · The decision
Composition data turns into collection design, plant capacity, targets and fees. It is the difference between planning and guessing.
Size sorting lines and set realistic capture targets for paper, plastics, glass and metals.
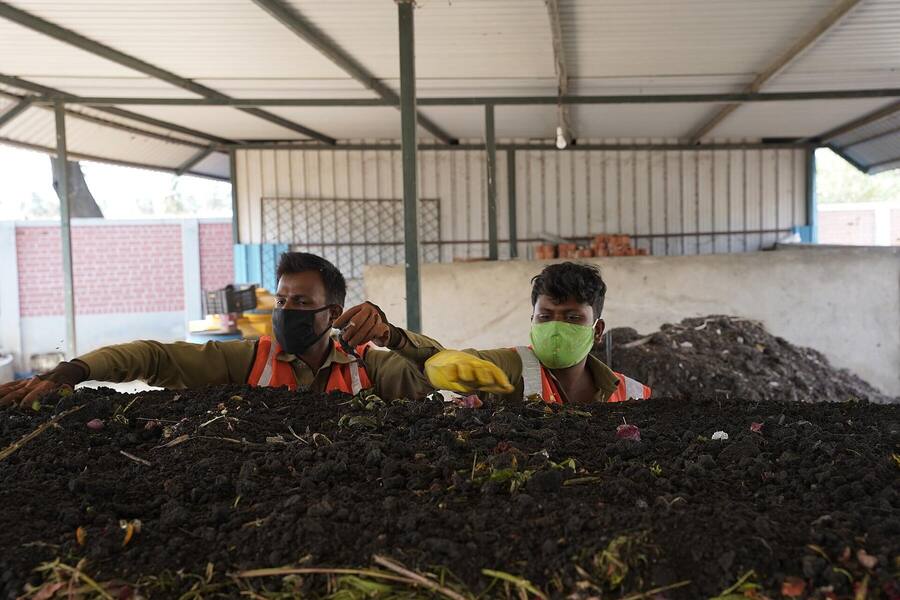
Plan separate food and garden collection, composting or anaerobic digestion from real tonnages.
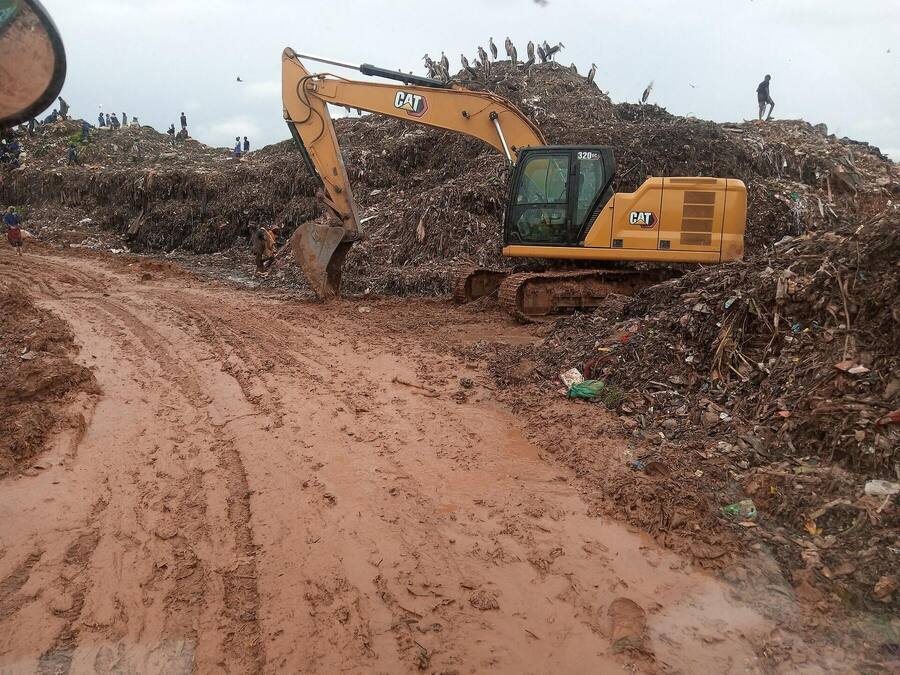
Measure what still reaches landfill, year after year, and prove that policies are working.
Chapter 09 · Who we serve
How much food waste would a separate collection really capture?
Baselines for waste plans, collection tenders and Zero Waste reporting.
What share of the bin is packaging, by material and format?
Data for fee modulation, recycled-content claims and deposit return design.
How much value is leaving the plant in the residue?
Input, product and residue audits that put a price on lost material.
What calorific value and chlorine will the fuel feed deliver?
Composition and laboratory data for RDF and SRF supply contracts.
What does our site throw away, and what can be avoided?
Site audits for operators that report on waste and want lower disposal costs.
Is the feasibility study built on measured data?
Independent field data for investment appraisals and master plans.
Chapter 10 · What we do
Seasonal, multi-zone sorting studies of household, commercial and construction waste, from one district to a whole country.
Stratification by zone, income, route and season, with sample sizes chosen to meet your precision target.
Input, output and residue audits that show capture rates, contamination and lost revenue.
Physical composition, particle size and sampling support for refuse-derived and solid recovered fuels.
Packaging share by material and format, used to set producer fees, targets and deposit return baselines.
Tablet sort sheets, connected scales, photo records and a results dashboard you keep after the study.
Methods aligned with ASTM D5231 EU SWA-Tool EN ISO 21645
Quality & safety
Every scale is checked with reference weights at the start of each shift, and the check is logged.
Sorted fractions must add up to the sample weight within a set tolerance before a sample counts.
Moisture, calorific value, chlorine and metals are tested in ISO/IEC 17025 accredited laboratories.
Cut-resistant gloves, respiratory protection, a sharps procedure and vaccinated crews on every site.
Each crew is inducted on the category tree with a photo guide and supervised by a field lead.
A second analyst checks weighting, outliers and intervals before any figure leaves the office.
Chapter 11 · Where we work
We mobilise field crews from İzmir, or recruit and train local sorters under our own field leads. Studies run on the same method wherever they happen.
 Europe
Middle East
Central Asia
Africa
South Asia
İzmir
Chapter 12 · Your study
Move the sliders to see how many samples, how much sorting and how long a study like yours usually takes.
Your area produces about 370 tonnes of waste a day at the global average.
Indicative only. Assumes 95% confidence, a coefficient of variation of 0.6 for the main fraction, about 110 kg per sample and 8 samples a day per crew.
Sample report
An eight-page sample report for a fictional city: sampling design, results with confidence intervals, and recommendations. PDF, in English.
Questions
It depends on how variable the waste is and how precise the results must be. Most municipal studies need 30 to 150 samples per season. The calculator above gives a first estimate, and we confirm it in the sampling plan.
Planning takes two to four weeks. Fieldwork takes one to three weeks per season. The final report follows three to four weeks after the last round.
Our methods are aligned with ASTM D5231 and the EU SWA-Tool for municipal waste, and EN ISO 21645 for sampling solid recovered fuels. Category trees are matched to your national reporting.
Yes. We bring crews and equipment from İzmir, or train local sorters under our own field leads. Reports are delivered in English or Turkish.
A full report, the raw data, the photo archive, access to the results dashboard and a methods annex that lets anyone repeat the study.
Access to collection routes, a covered area of about 100 m² near the trucks, and a contact person in the operations team. We bring the tables, scales and protective equipment.
Chapter 13 · Your chapter
Tell us about the waste stream, the area and the decision you need to make. We reply with a sampling outline and a cost estimate.